Visualizing US Government Spending

A Unique View of Federal, State & Local Spending

By JOE MARAZZO

The Government…

That simple word stirs up a lot of different emotions. It’s the biggest mover and shaker in the US economy due its massive tax and spend ability.

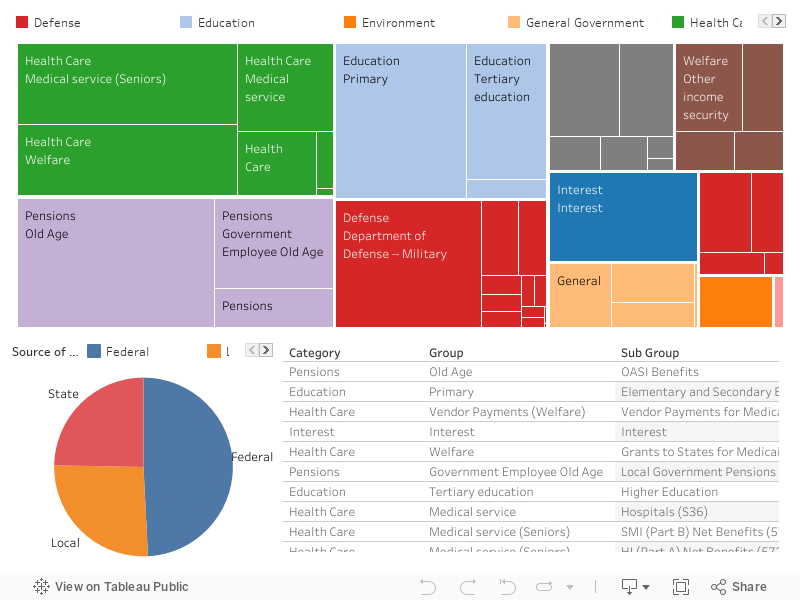
Silly question, but what really is the government? Turns out it’s pretty nebulous. While there is one federal government, there are sub organizations that have some unique differences. There are the obvious 50 states and not so obvious 16 territorial governments, and within those are over 80,000 cities, counties and tribes that all make up the US government.

Turns out these small local governments are small individually but together they make up most of the government’s actual spending. Let’s explore how the government(s) collectively spend their taxes on the people!

Takeaways

  • 35% of Americans are on government healthcare. Americans spend on average $10k per person on healthcare and the government pays for 53% of all healthcare costs. We also spend 2.5x more per person on healthcare than the UK  

  • 17% of Americans are on Social Security, receiving an average of $13,000/year 

  • 2.5% of Americans are on disability, receiving an average of $20,000/year

  • Retired government employees collect $430B/year in pensions

  • 15% of Americans are K-12 students, costing $13,000/year per student

  • With total government debt at 24.5 trillion, government pays an effective interest rate of 1.9%. Expect interest expenses to greatly increase over the next couple years now that new 1 year government notes cost 2.5% (Mar 2019)